
Mermaid.js is pretty, pretty, pretty good
I come from a world where Google Slides and Powerpoint were the defacto tools to create architecture diagrams. It was a decent experience once you got the hang of the tools. They were definitely powerful but a pain to maintain. This is largely because the image would be exporting as an image and live as a binary file in a git repo. This is bad for many reasons (file size and being unable to show differences between versions easily are ones that come to mind)
I had tried to use ascii diagrams before but honestly even with online tools to speed up the process I found myself faster just using a more powerful tool. Plus, they often looked boring as hell.
Mermaid.js is a Javascript based diagramming tool that uses Markdown-inspired text definitions to create diagrams. Though Mermaid.js has been around for a while, having GitHub support Mermaid.js diagrams gave the tool a huge boost in usage.
Right around this time, I needed to create an architecture diagram for a new project so I decided to give it a try. There are plenty of examples in their docs. But, by far, the most useful tool is the Live Editor. What a great tool for people to try it out easily.
I ended up creating an image for my project, see the diagram below, and the syntax for it just underneath.
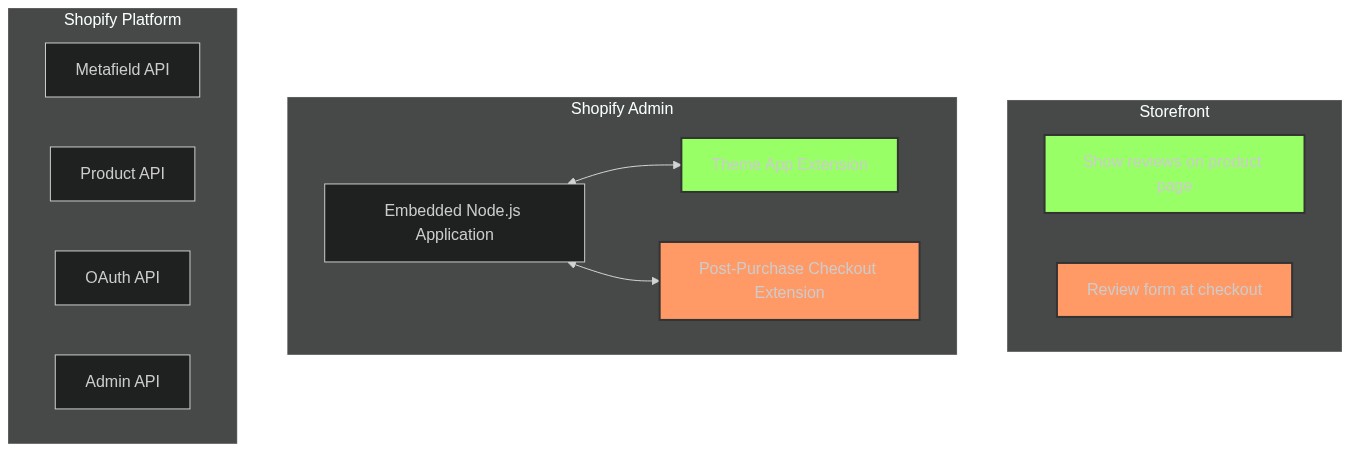
Mermaid.js syntax
flowchart
    subgraph Storefront
        %%ratings[Show reviews on product page <img src='https://iconscout.com/ms-icon-310x310.png' class="center" height='40px' width='40px'>]
        ratings[Show reviews on product page]
        feedback[Review form at checkout]
    end

    subgraph Shopify Admin
        ac[Embedded Node.js Application] <--> te[Theme App Extension]
        ac[Embedded Node.js Application] <--> pc[Post-Purchase Checkout Extension]
    end

    subgraph Shopify Platform
        meta[Metafield API]
        products[Product API]
        oauth[OAuth API]
        Admin[Admin API]
    end

     classDef green fill:#9f6,stroke:#333,stroke-width:2px;
     classDef orange fill:#f96,stroke:#333,stroke-width:2px;
     class te,ratings green
     class feedback,pc orange
Overall, Mermaid.js is fairly easy to use (once the platform supports the definition) if a bit more limiting than a more powerful tool like Google Slides. It’ll more than likely become my go-to approach for creating diagrams and I’ll resort to my old methods if I need something very specific.